A practical, science-based view of the living soil ecosystem, designed to help you understand how to support lasting biological improvement.
The soil biology report provides a detailed look at the bacteria, fungi, and higher-order organisms that make up the living ecosystem beneath the surface.
Each sample is evaluated with a strong emphasis on diversity, because a broader and more balanced soil community is often associated with greater resilience and better long-term performance.
The report includes detailed biological data while also helping explain what those patterns may mean for soil health, crop performance, and management decisions.
Rather than treating soil as a single uniform system, the analysis helps reveal how biology may differ across fields, zones, or management areas.
The report is designed to help growers understand not only what is present now, but also how to support biological improvement over time.
By looking at bacteria, fungi, protozoa, and other biological signals together, the report provides a broader view of how the soil ecosystem is structured and functioning.
In addition to reporting results, the goal is to help customers better understand soil biology and the practices that can support a more diverse and active soil community.
This is GenTrek Labs’ standard soil biology report, providing a foundational analysis of the biological life present in a soil sample.
View different key areas of the soil report by clicking on the associated topic
Abundance curves show the most represented species in a soil sample and the percentage each contributes to the overall biological profile. A steep curve may suggest that a small number of organisms dominate the sample, while a more gradual curve generally reflects broader diversity and balance. Because biological diversity is one of the strongest indicators of soil resilience and long-term success, this view helps reveal whether the soil community is broad and well-rounded or overly concentrated around a few major groups.
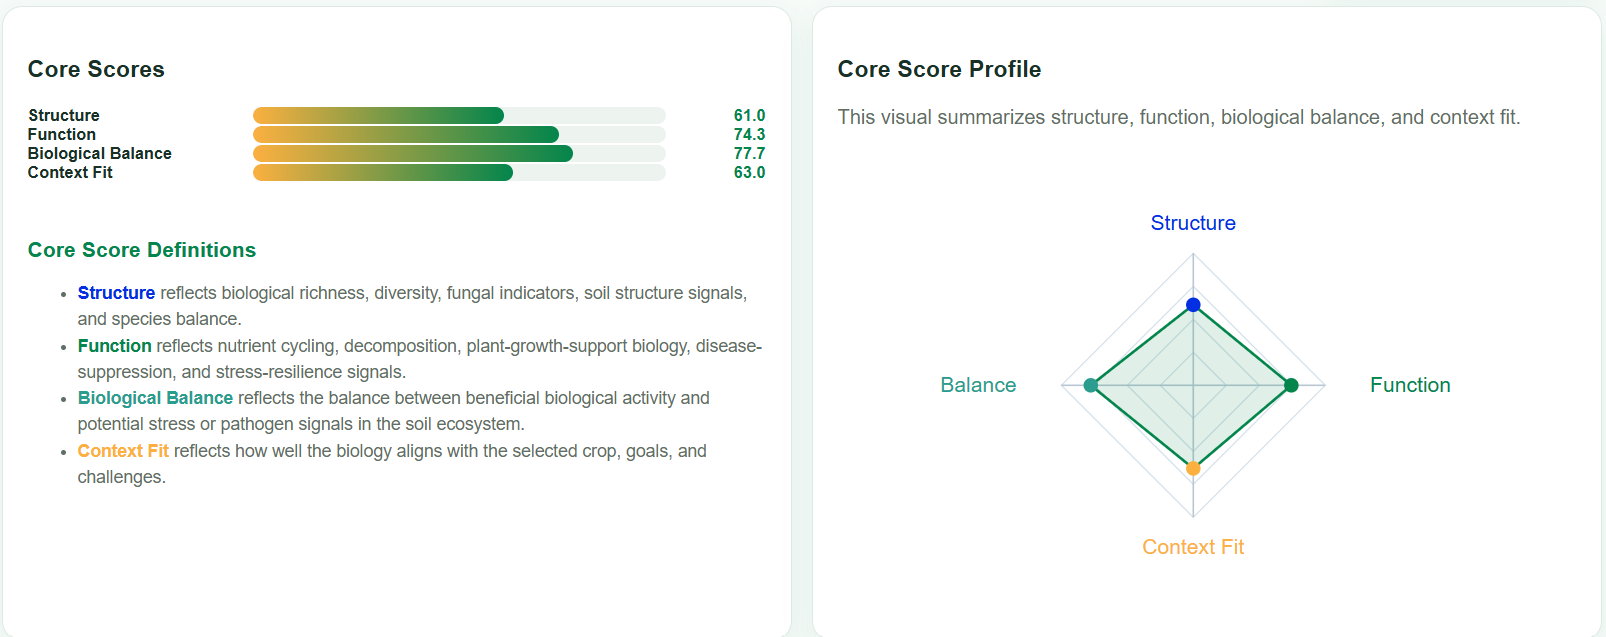
The core scoring section summarizes four key traits of the soil sample in a simple diamond graph: structure, function, balance, and context fit. Structure reflects overall biological richness and species balance, while function highlights signals tied to stress resilience and biological capacity. Balance compares beneficial biological activity against potential pathogen pressure, and context fit shows how closely the results align with the grower’s stated goals. Each sample is assigned these values as a numerical representation of its performance in that area.
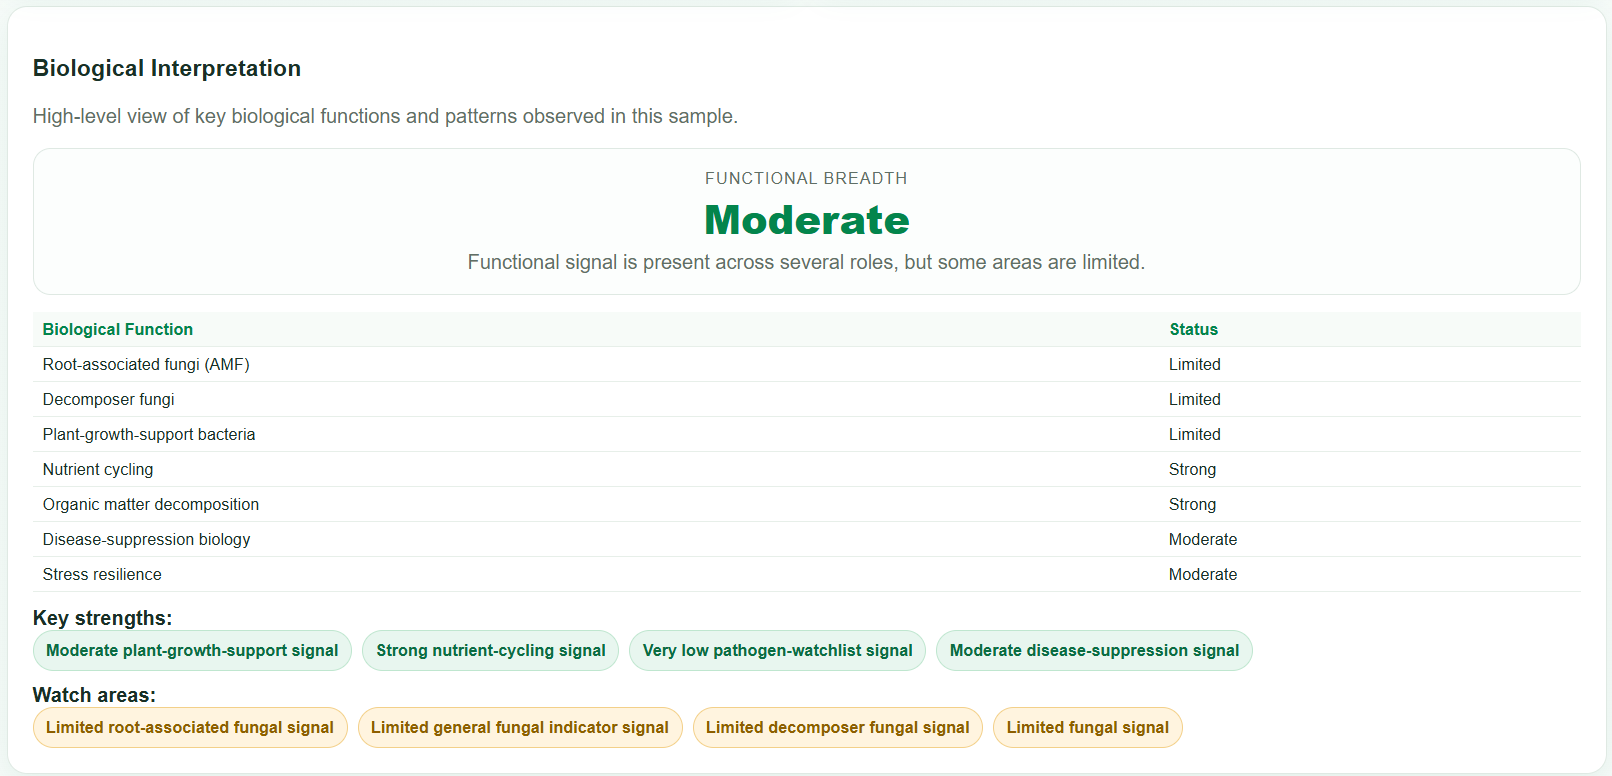
The context evaluation section translates the sample results into a practical summary of overall soil health, including a high-level rating from poor to exceptional. It identifies key strengths, watch areas, and notable biological patterns, such as missing or limited species, strong or weak functional representation, and standout features of the field. Each point is interpreted in the specific context of the sample, so the evaluation is not just a generic score but a focused view of what appears most relevant for that soil, crop system, and stated goals.
See how soil biology differs across fields, zones, and timepoints so strengths, weaknesses, and improvements are easier to identify.
![[background image]](https://cdn.prod.website-files.com/69b2dc5819a956251d403f08/6a07650e3b0eae6bfeac9487_Bacteria%20Heatmap.png)
Our cross-sample heatmaps make it easier to compare soil biology across multiple fields, beds, zones, or management areas. By viewing samples together, you can quickly see which locations stand out as biologically stronger, which appear limited, and where important differences may be shaping crop performance.
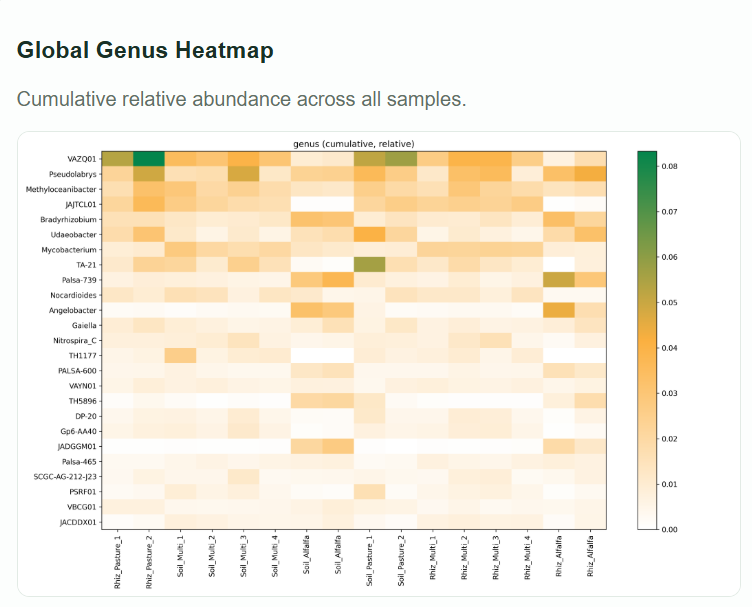
When samples are collected over multiple seasons or after management changes, heatmaps can help show how soil biology is shifting over time. This makes it possible to look for signs of improvement, identify areas that are not responding as expected, and better understand whether soil-building practices are moving biology in the right direction.
Find quick answers about our process, timing, and services. We’re here to make soil testing simple and stress-free.
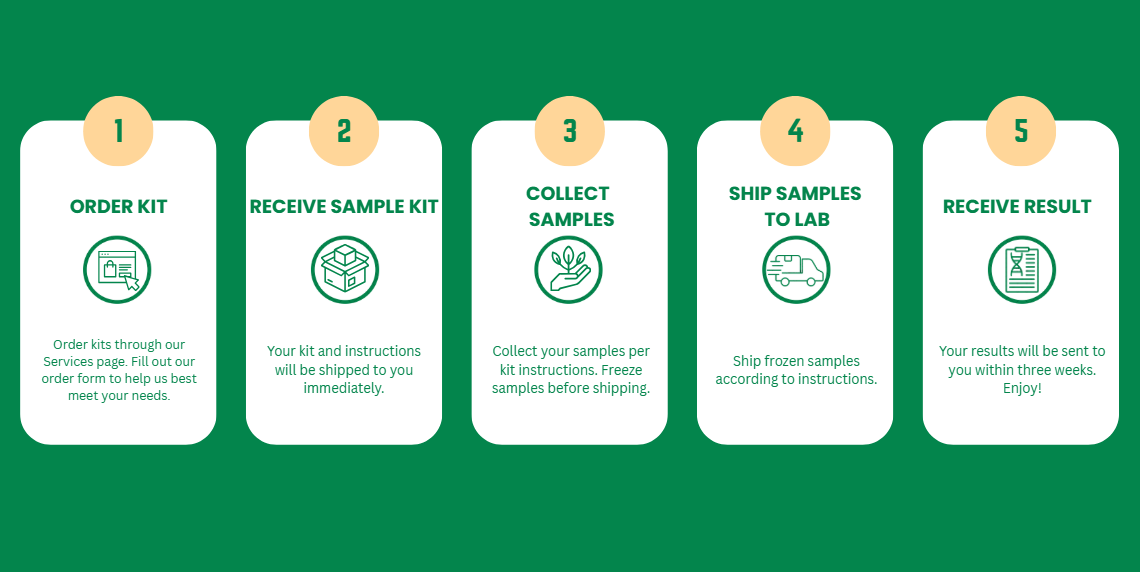
Request a kit from us, collect your soil, and mail it back using the prepaid label. We’ll handle the rest and keep you updated.
Most results are ready within weeks after we receive your sample. We’ll notify you as soon as your report is available.
We accept soil, root, leaf, and seed samples. Each test is $150 per sample, and you can mix and match as needed.
Yes! You can send multiple samples from different spots. Each will be analyzed separately for detailed insights.
You’ll get a clear summary of your results, easy-to-follow recommendations, and tips to improve your soil health.
Absolutely. If you have questions about your results or next steps, our team is here to help you make the most of your data.
Have a question? Send us a message.